Building a candlestick chart engine on raw Canvas2D (no chart library)
Originally published on Dev.to.
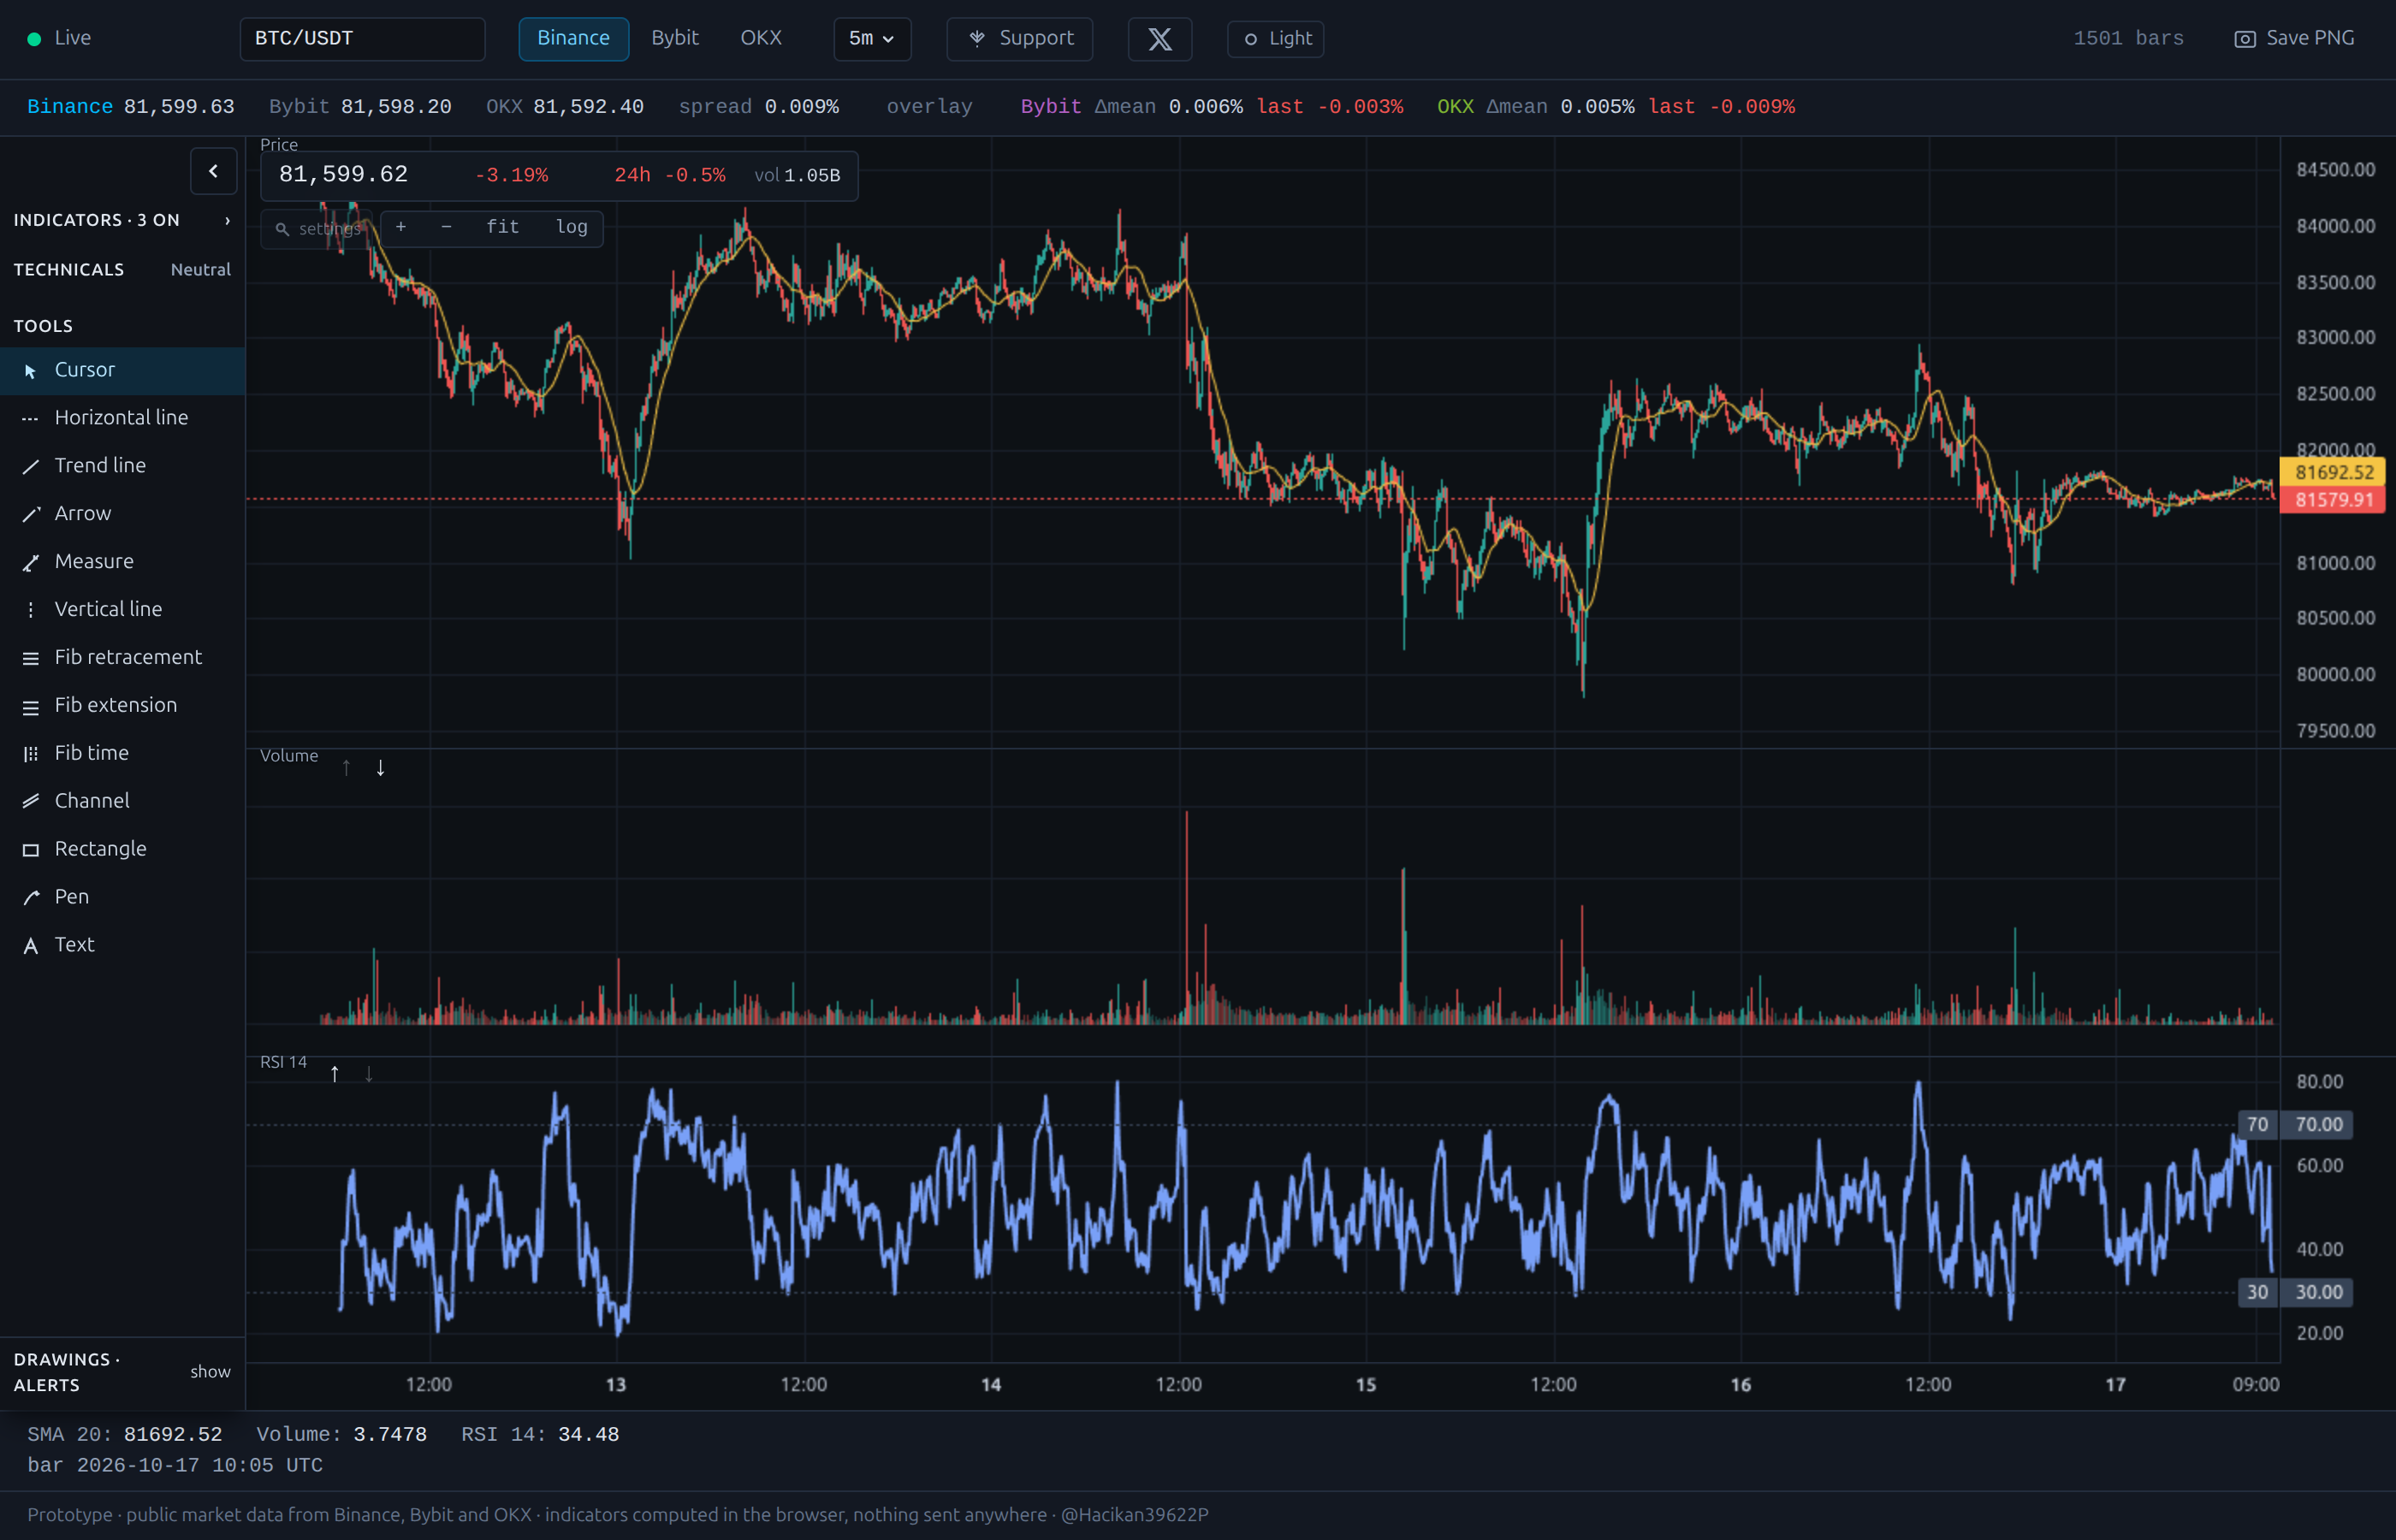
Every charting tutorial reaches for a library. I ended up hand-writing the engine instead, and it turned out to be less code than I expected — plus three performance lessons I hadn't anticipated.
This is what I learned plotting candlesticks on raw Canvas2D, with the naive version first so you can see exactly what goes wrong.
The naive version
The obvious approach is to redraw everything on every frame:
function draw() {
  ctx.clearRect(0, 0, canvas.width, canvas.height);
  for (const candle of visible) drawCandle(ctx, candle);
  for (const obj of drawings) drawDrawing(ctx, obj);
  requestAnimationFrame(draw);
}
It works. It's also redrawing 1500 candles, 3 overlays and every drawing object 60 times a second, while nothing has changed.
Lesson 1: only redraw when something changed
Live crypto data doesn't tick at 60Hz. It ticks maybe a few times a second, and usually only the last candle changes. So separate the render from the loop:
let dirty = true;

function markDirty() { dirty = true; }

function frame() {
  if (dirty) {
    render();
    dirty = false;
  }
  requestAnimationFrame(frame);
}

// data arrives
ws.onmessage = (msg) => {
  updateLastCandle(msg);
  markDirty();
};

// user pans or zooms
canvas.addEventListener('wheel', (e) => {
  zoom(e.deltaY);
  markDirty();
});
Panning and zooming do change everything, so those set the flag. Price ticks usually don't. That one change took my idle CPU from ~15% to near zero.
Lesson 2: cache what doesn't move
The background grid, axis labels and the historical candles (everything except the last one) are static between data ticks. Draw them once into an offscreen canvas, then blit:
const back = document.createElement('canvas');

function rebuildBackBuffer() {
  back.width = canvas.width;
  back.height = canvas.height;
  const bctx = back.getContext('2d');
  drawGrid(bctx);
  drawAxes(bctx);
  drawCandles(bctx, candles.slice(0, -1));   // everything but the live candle
}

function render() {
  ctx.drawImage(back, 0, 0);                 // one call instead of thousands
  drawCandle(ctx, candles[candles.length - 1]);  // just the live one
  drawings.forEach((o) => drawDrawing(ctx, o));
}
Rebuild the back buffer only on pan/zoom/timeframe change. On a price tick you're now drawing one candle, not 1500.
Lesson 3: indicators as pure functions over typed arrays
Indicator code gets tangled when it reads from the chart's data model. Keep it pure — take arrays in, return arrays out:
function sma(values, period) {
  const out = new Float64Array(values.length).fill(NaN);
  let sum = 0;
  for (let i = 0; i < values.length; i++) {
    sum += values[i];
    if (i >= period) sum -= values[i - period];
    if (i >= period - 1) out[i] = sum / period;
  }
  return out;
}

function ema(values, period) {
  const out = new Float64Array(values.length);
  const k = 2 / (period + 1);
  out[0] = values[0];
  for (let i = 1; i < values.length; i++) {
    out[i] = values[i] * k + out[i - 1] * (1 - k);
  }
  return out;
}
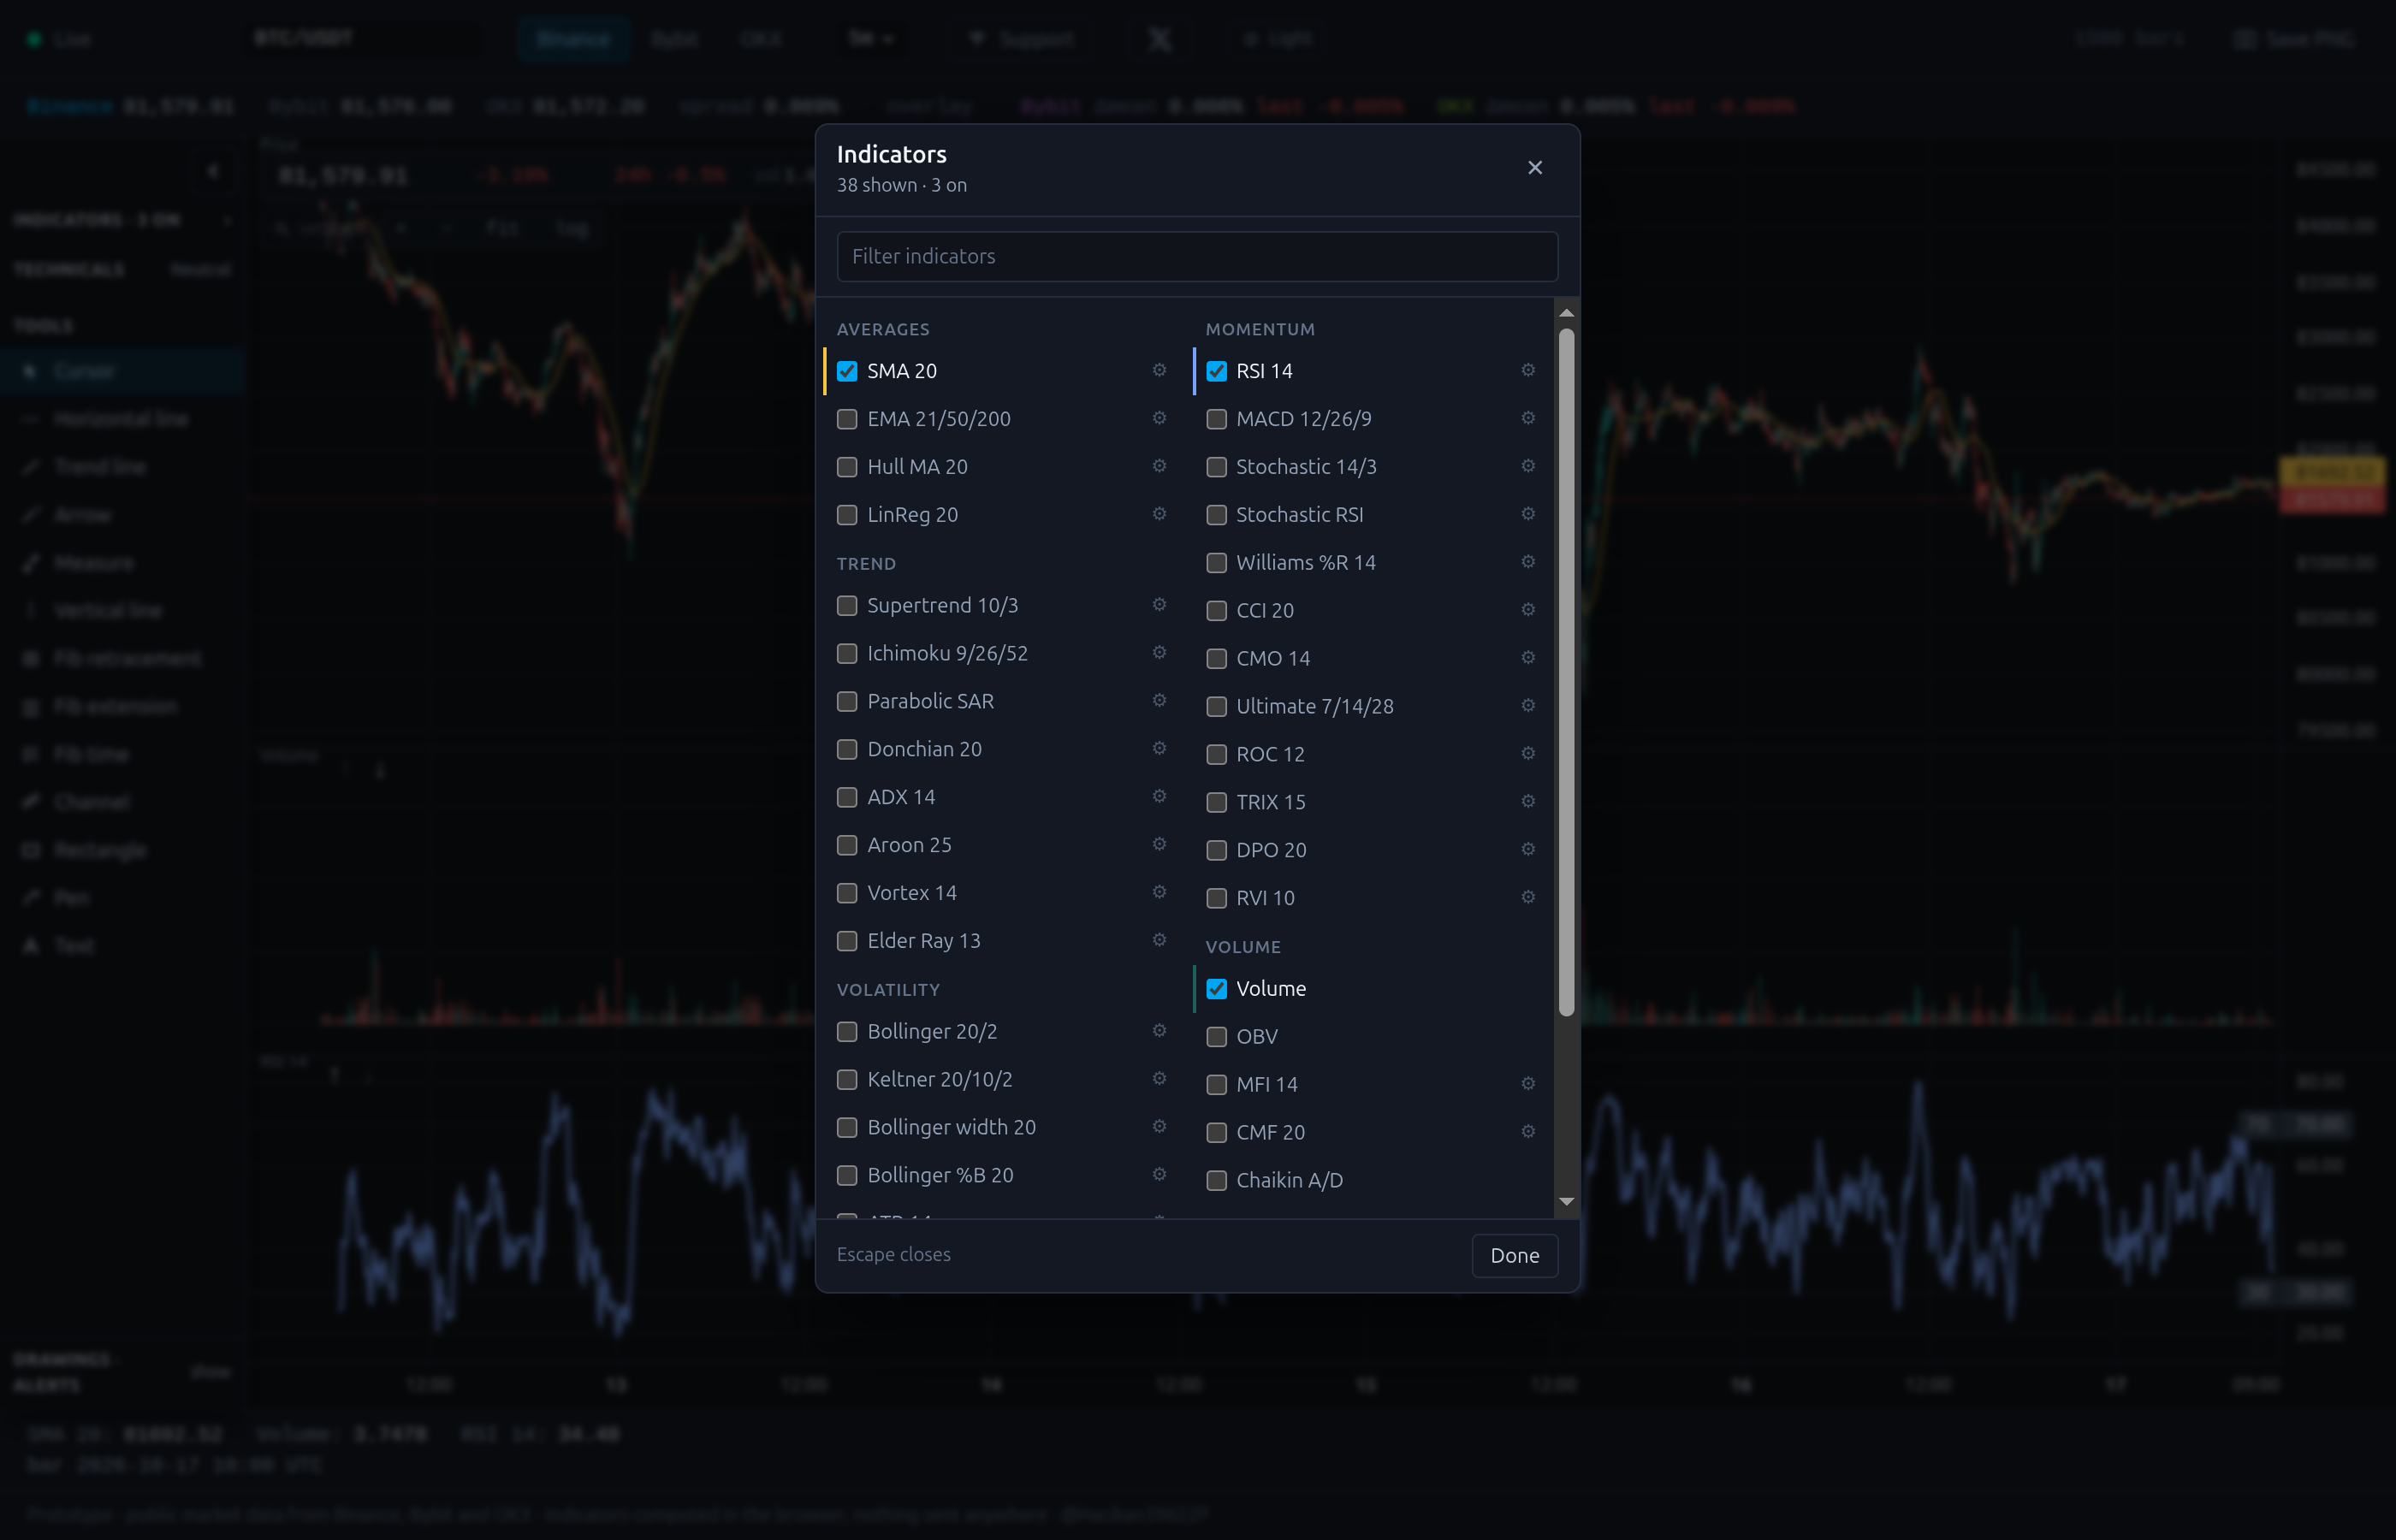
Typed arrays matter here — with 1500 bars and 38 indicators recomputed on every timeframe switch,
Float64Arrayvs a plainArraywas a measurable difference, and it keeps the GC quiet.Because they're pure, they're also trivially testable:
test('sma of a constant series is that constant', () => {
  const out = sma([5, 5, 5, 5, 5], 3);
  assert.equal(out[4], 5);
});
Lesson 4: hit-testing drawing objects in chart space
Drawing tools (trend lines, Fibonacci, rectangles) have to survive pan and zoom. The trick is to do hit-testing in chart coordinates, not pixels — convert the mouse position once, then everything is plain geometry:
function toChartCoords(mouseX, mouseY) {
  return {
    x: viewStartIndex + mouseX / candleWidth,
    y: priceMin + (canvas.height - mouseY) / canvas.height * (priceMax - priceMin),
  };
}

function hitTest(line, chartPoint, toleranceInBars) {
  // distance from point to segment, in chart units
  const d = distanceToSegment(chartPoint, line.a, line.b);
  return d < toleranceInBars;
}
Because the objects live in chart space, zooming doesn't move them relative to the data — which is exactly what a trader expects a trend line to do.
The one trading thing that surprised me
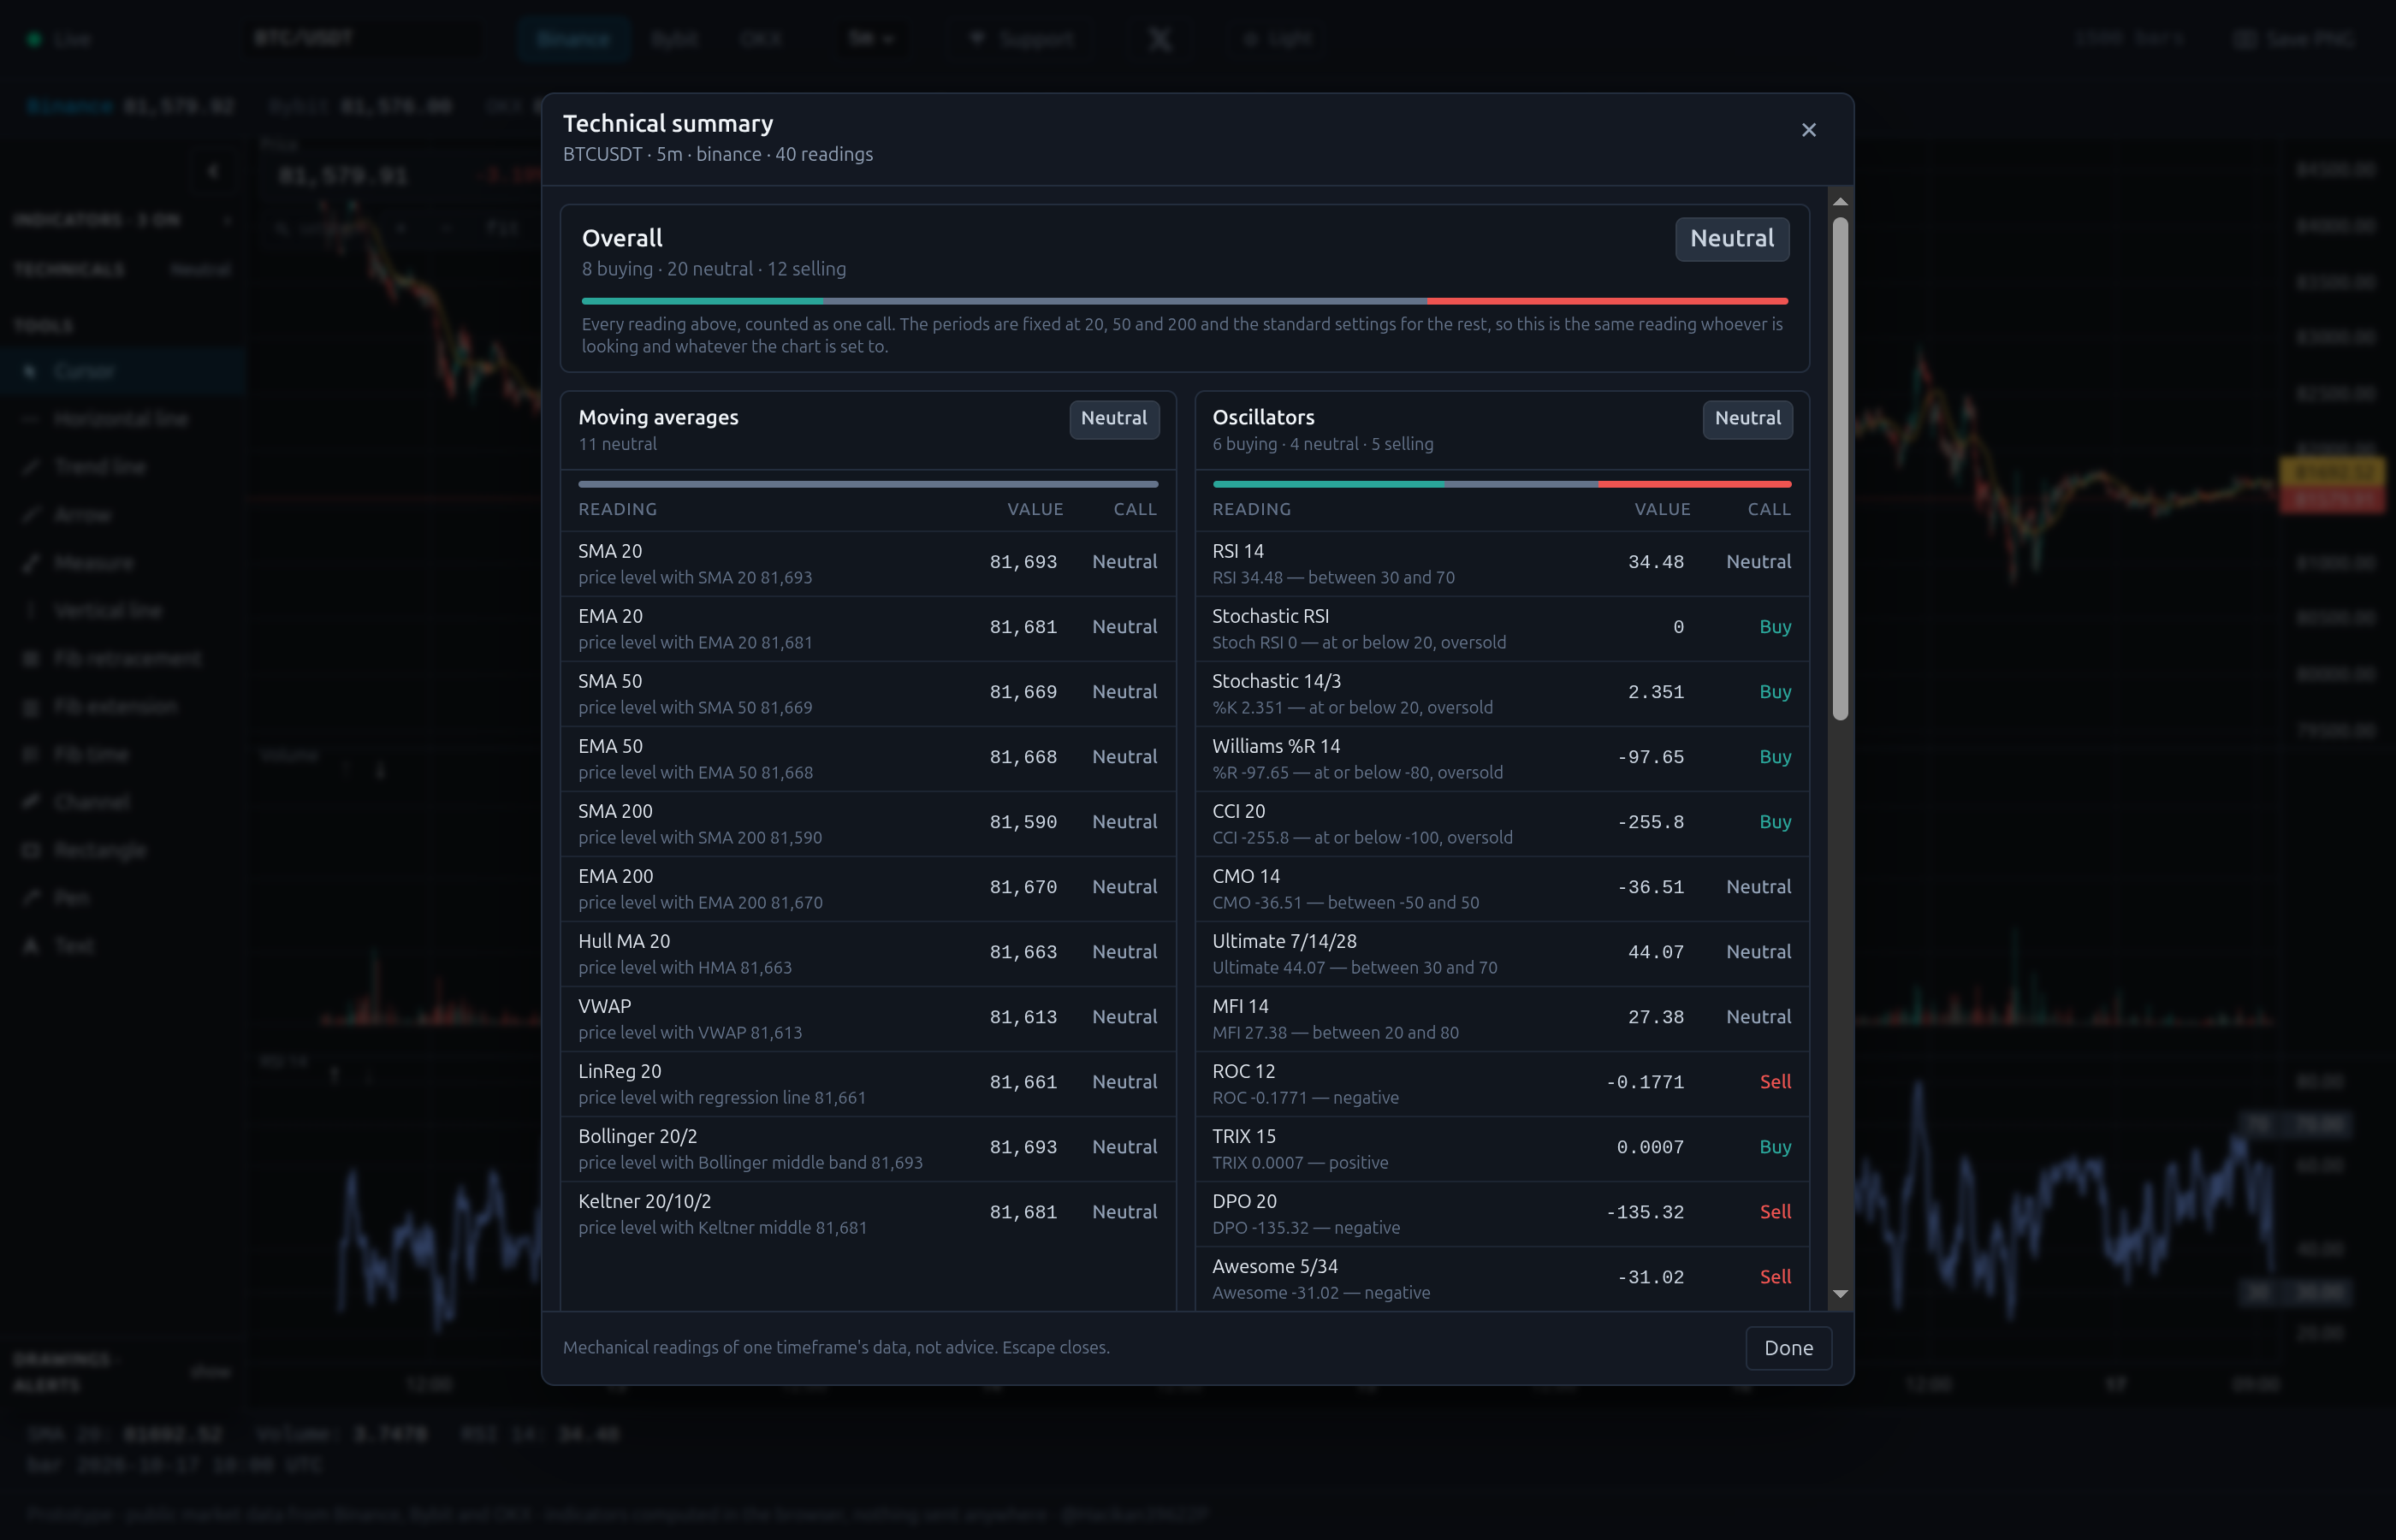
I built this to put Binance, Bybit and OKX on one chart, mostly to see the spread between them. What I didn't expect: the absolute spread is boring (a few basis points on BTC), but the first tick where it jumps is informative — the venue spread usually widens before the candles react.
That's a property of the data, not the canvas, but it's the reason the project exists at all.
Takeaway
You don't need a chart library for a charting app. You need:
a dirty flag, so you render on change rather than on frame,
an offscreen back buffer for everything that didn't change,
pure indicator functions over typed arrays,
drawing objects in chart space.
That's the whole engine.
If you want to see the result (38 indicators, 3 exchanges, one canvas, no signup): cryptota.duckdns.org. Happy to go deeper on any of the four pieces in the comments.
About the author
- I build browser-based trading tools. My main project is TA Platform — a multi-exchange terminal that plots Binance, Bybit and OKX on one canvas and computes the spread between them in real time. 38 indicators and 12 drawing tools, all hand-written on raw Canvas2D, no chart library. Everything runs client-side: no signup, no email.
Comments
Join the discussionFast and clean